PowerHouse SwiftEdge AI v2.10 with Custom Filters & AI AnalysisPowerHouse SwiftEdge AI v2.10 with Custom Filters & AI Analysis
Overview
PowerHouse SwiftEdge AI v2.10 is an advanced TradingView Pine Script indicator designed to identify high-probability trading setups by combining pivot-based structure analysis, multi-timeframe trend detection, and adaptive AI-driven signal filtering. The script integrates Change of Character (CHoCH) and Break of Structure (BOS) signals with customizable momentum, volume, breakout, and trend filters to enhance trade precision. Additionally, it offers an optional AI Market Analysis module that predicts future price trends across multiple timeframes, providing traders with a comprehensive market outlook.
The script is highly customizable, allowing users to tailor inputs to their trading style, whether for scalping, swing trading, or long-term strategies. It is suitable for all asset classes, including stocks, forex, crypto, and commodities, and performs optimally on timeframes ranging from 1-minute to daily charts.
Key Features
Pivot-Based Signal Generation:
Identifies pivot highs and lows to detect CHoCH (reversal patterns) and BOS (continuation patterns).
Signals are plotted as "Buy" or "Sell" labels with optional "Get Ready" pre-signals to prepare traders for potential setups.
Take-profit (TP) levels are automatically calculated based on user-defined points, with optional TP box visualization.
Multi-Timeframe Trend Analysis:
Analyzes trends across seven timeframes (1M, 5M, 15M, 30M, 1H, 4H, D) using EMA and VWAP to determine bullish, bearish, or neutral conditions.
Displays a futuristic AI-Trend Matrix dashboard showing trend direction, strength, and confidence levels for quick decision-making.
Customizable Signal Filters:
Momentum Filter: Ensures signals align with significant price changes, adjusted dynamically using ATR-based volatility.
Higher Timeframe Trend Filter: Requires signals to align with the trend of a user-selected higher timeframe (e.g., 1H).
Lower Timeframe Trend Filter: Prevents signals that conflict with the trend of a user-selected lower timeframe (e.g., 5M).
Volume Filter: Optionally requires above-average volume to confirm signals.
Breakout Filter: Optionally requires price to break previous highs/lows for signal validation.
Repeated Signal Restriction: Prevents consecutive signals in the same trend direction until the trend changes on a user-defined timeframe.
AI-Driven Adaptivity:
Incorporates Cumulative Volume Delta (CVD) to assess buying/selling pressure and classify market volatility (Low, Medium, High).
Uses ATR to dynamically adjust momentum thresholds, ensuring signals adapt to current market conditions.
Optional AI Market Analysis module predicts trends across multiple timeframes by combining trend, momentum, and volatility scores.
Visual Elements:
Plots CHoCH and BOS levels as horizontal lines with distinct colors (aqua for CHoCH sell, lime for CHoCH buy, fuchsia for BOS sell, teal for BOS buy).
Draws dynamic support and resistance trendlines based on short and long-term price action, colored by trend strength.
Displays TP levels and pivot highs/lows for easy reference.
How It Works
The script combines several technical analysis concepts to create a robust trading system:
Market Structure Analysis:
Pivot highs and lows are identified using a user-defined lookback period (Pivot Length).
CHoCH occurs when price crosses below a pivot high (bearish reversal) or above a pivot low (bullish reversal).
BOS occurs when price breaks a previous pivot low (bearish continuation) or pivot high (bullish continuation).
Trend and Momentum Integration:
Trends are determined by comparing price to EMA and VWAP on multiple timeframes.
Momentum is calculated as the percentage price change, with thresholds adjusted by ATR to account for volatility.
"Get Ready" signals appear when momentum approaches the threshold, preparing traders for potential CHoCH or BOS signals.
Signal Filtering:
Filters ensure signals align with user-defined criteria (e.g., trend direction, volume, breakouts).
The Restrict Repeated Signals option prevents over-signaling by requiring a trend change on a specified timeframe before generating a new signal in the same direction.
AI Market Analysis:
The optional AI module calculates a score for each timeframe based on trend direction, momentum, and volatility (ATR compared to its SMA).
Scores are translated into predictions (▲ for bullish, ▼ for bearish, — for neutral), displayed in a dedicated table.
CVD and Volatility Context:
CVD tracks buying vs. selling pressure by accumulating volume based on price direction.
Volatility is classified using CVD magnitude, influencing the script’s visual cues and signal sensitivity.
Why This Combination?
The integration of pivot-based structure analysis, multi-timeframe trend filtering, and AI-driven adaptivity addresses common trading challenges:
Precision: CHoCH and BOS signals focus on key market turning points, reducing noise from minor price fluctuations.
Context: Multi-timeframe analysis ensures trades align with broader market trends, improving win rates.
Adaptivity: ATR and CVD adjustments make the script responsive to changing market conditions, avoiding static thresholds that fail in volatile or quiet markets.
Customization: Extensive input options allow traders to adapt the script to their preferred markets, timeframes, and risk profiles.
Predictive Insight: The AI Market Analysis module provides forward-looking trend predictions, helping traders anticipate market moves.
This combination creates a self-contained system that balances responsiveness with reliability, making it suitable for both novice and experienced traders.
How to Use
Add to Chart:
Apply the indicator to your TradingView chart for any asset and timeframe.
Recommended timeframes: 5M to 1H for scalping/day trading, 4H to D for swing trading.
Configure Inputs:
Pivot Length: Adjust (default 5) to control sensitivity to pivot highs/lows. Lower values for faster signals, higher for stronger confirmations.
Momentum Threshold: Set the minimum price change (default 0.01%) for signals. Increase for stricter conditions.
Take Profit Points: Define TP distance (default 10 points). Adjust based on asset volatility.
Signal Filters: Enable/disable filters (momentum, trend, volume, breakout) to match your strategy.
Higher/Lower Timeframe: Select timeframes for trend alignment (e.g., 1H for higher, 5M for lower).
AI Market Analysis: Enable for predictive trend insights across timeframes.
Get Ready Signals: Enable to see pre-signals for potential setups.
Interpret Signals:
Buy/Sell Labels: Act on green "Buy" or red "Sell" labels, confirming with TP levels and trend direction.
Get Ready Labels: Yellow "Get Ready BUY" or orange "Get Ready SELL" indicate potential setups; prepare but wait for confirmation.
CHoCH/BOS Lines: Use aqua/lime (CHoCH) and fuchsia/teal (BOS) lines as key support/resistance levels.
AI-Trend Matrix: Check the top-right dashboard for trend strength (%), confidence (%), and timeframe-specific trends.
AI Market Analysis Table: If enabled, view predictions (▲/▼/—) for each timeframe to anticipate market direction.
Trading Tips:
Combine signals with other indicators (e.g., RSI, MACD) for additional confirmation.
Use higher timeframe trend alignment for higher-probability trades.
Adjust TP and signal distance based on asset volatility and trading style.
Monitor the AI-Trend Matrix for trend strength; values above 50% or below -50% indicate strong directional bias.
Originality
PowerHouse SwiftEdge AI v2.10 stands out due to its unique blend of:
Adaptive Signal Generation: ATR-based momentum thresholds and CVD-driven volatility context ensure signals remain relevant across market conditions.
Multi-Timeframe Synergy: The script’s ability to filter signals based on both higher and lower timeframe trends provides a rare balance of precision and context.
AI-Powered Insights: The AI Market Analysis module offers predictive capabilities not commonly found in traditional indicators, simulating institutional-grade analysis.
Visual Clarity: The futuristic dashboard and color-coded trendlines make complex data accessible, enhancing usability for all trader levels.
Unlike standalone pivot or trend indicators, this script integrates multiple layers of analysis into a cohesive system, reducing false signals and providing actionable insights without requiring external tools or research.
Limitations
False Signals: No indicator is foolproof; signals may fail in choppy or low-volume markets. Use filters to mitigate.
Timeframe Sensitivity: Performance varies by timeframe and asset. Test settings thoroughly.
AI Predictions: The AI Market Analysis is based on historical data and simplified scoring; it’s not a guaranteed forecast.
Resource Usage: Enabling all filters and AI analysis may slow performance on lower-end devices.
Cari dalam skrip untuk "Buy sell"

ICT Swiftedge# ICT SwiftEdge: Advanced Market Structure Trading System
**Overview**
ICT SwiftEdge is a powerful trading system built upon the foundation of ICTProTools' ICT Breakers, licensed under the Mozilla Public License 2.0 (mozilla.org). This script has been significantly enhanced by to combine market structure analysis with modern technical indicators and a sleek, AI-inspired statistics dashboard. The goal is to provide traders with a comprehensive tool for identifying high-probability trade setups, managing exits, and tracking performance in a visually intuitive way.
**Credits**
This script is a derivative work based on the original "ICT Breakers" by ICTProTools, used with permission under the Mozilla Public License 2.0. Significant enhancements, including RSI-MA signals, trend filtering, dynamic timeframe adjustments, dual exit strategies, and an AI-style statistics dashboard, were developed by . We express our gratitude to ICTProTools for their foundational work in market structure analysis.
**What It Does**
ICT SwiftEdge integrates multiple trading concepts to help traders identify and manage trades based on market structure and momentum:
- **Market Structure Analysis**: Identifies Break of Structure (BOS) and Market Structure Shift (MSS) patterns, which signal potential trend continuations or reversals. BOS indicates a continuation of the current trend, while MSS highlights a shift in market direction, providing key entry points.
- **RSI-MA Signals**: Generates "BUY" and "SELL" signals when BOS or MSS patterns align with the Relative Strength Index (RSI) smoothed by a Moving Average (RSI-MA). Signals are filtered to occur only when RSI-MA is above 50 (for buys) or below 50 (for sells), ensuring momentum supports the trade direction.
- **Trend Filtering**: Prevents multiple signals in the same trend, ensuring only one buy or sell signal per trend direction, reducing noise and improving trade clarity.
- **Dynamic Timeframe Adjustment**: Automatically adjusts pivot points, RSI, and MA parameters based on the selected chart timeframe (1M to 1D), optimizing performance across different market conditions.
- **Flexible Exit Strategies**: Offers two user-selectable exit methods:
- **Trailing Stop-Loss (TSL)**: Exits trades when price moves against the position by a user-defined distance (in points), locking in profits or limiting losses.
- **RSI-MA Exit**: Exits trades when RSI-MA crosses the 50 level, signaling a potential loss of momentum.
- Users can enable either or both strategies, providing flexibility to adapt to different trading styles.
- **AI-Style Statistics Dashboard**: Displays real-time trade performance metrics in a futuristic, neon-colored interface, including total trades, wins, losses, win/loss ratio, and win percentage. This helps traders evaluate the system's effectiveness without external tools.
**Why This Combination?**
The integration of these components creates a synergistic trading system:
- **BOS/MSS and RSI-MA**: Combining market structure breaks with RSI-MA ensures entries are based on both price action (structure) and momentum (RSI-MA), increasing the likelihood of high-probability trades.
- **Trend Filtering**: By limiting signals to one per trend, the system avoids overtrading and focuses on significant market moves.
- **Dynamic Adjustments**: Timeframe-specific parameters make the system versatile, suitable for scalping (1M, 5M) or swing trading (4H, 1D).
- **Dual Exit Strategies**: TSL protects profits during trending markets, while RSI-MA exits are ideal for range-bound or reversing markets, catering to diverse market conditions.
- **Statistics Dashboard**: Provides immediate feedback on trade performance, enabling data-driven decision-making without manual tracking.
This combination balances technical precision with user-friendly visuals, making it accessible to both novice and experienced traders.
**How to Use**
1. **Add to Chart**: Apply the script to any TradingView chart.
2. **Configure Settings**:
- **Chart Timeframe**: Select your chart's timeframe (1M to 1D) to optimize parameters.
- **Structure Timeframe**: Choose a timeframe for market structure analysis (leave blank for chart timeframe).
- **Exit Strategy**: Enable Trailing Stop-Loss (`useTslExit`), RSI-MA Exit (`useRsiMaExit`), or both. Adjust `tslPoints` for TSL distance.
- **Show Signals/Labels**: Toggle `showSignals` and `showExit` to display "BUY", "SELL", and "EXIT" labels.
- **Dashboard**: Enable `showDashboard` to view trade statistics. Customize colors with `dashboardBgColor` and `dashboardTextColor`.
3. **Trading**:
- Look for "BUY" or "SELL" labels to enter trades when BOS/MSS aligns with RSI-MA.
- Exit trades at "EXIT" labels based on your chosen strategy.
- Monitor the statistics dashboard to track performance (total trades, win/loss ratio, win percentage).
4. **Alerts**: Set up alerts for BOS, MSS, buy, sell, or exit signals using the provided alert conditions.
**License**
This script is licensed under the Mozilla Public License 2.0 (mozilla.org). The source code is available for review and modification under the terms of this license.
**Compliance with TradingView House Rules**
This publication adheres to TradingView's House Rules and Scripts Publication Rules. It provides a clear, self-contained description of the script's functionality, credits the original author (ICTProTools), and explains the rationale for combining indicators. The script contains no promotional content, offensive language, or proprietary restrictions beyond MPL 2.0.
**Note**
Trading involves risk, and past performance is not indicative of future results. Always backtest and validate the system on your preferred markets and timeframes before live trading.
Enjoy trading with ICT SwiftEdge, and let data-driven insights guide your decisions!

Weighted Ichimoku StrategyLSE:HSBA
The Ichimoku Kinko Hyo indicator is a comprehensive tool that combines multiple signals to identify market trends and potential buying/selling opportunities. My weighted variant of this strategy attempts to assign specific weights to each signal, allowing for a more nuanced and customizable approach to trend identification. The intent is to try and make a more informed trading decision based on the cumulative strength of various signals.
I've tried not to make it a mishmash of this and that + MACD + RSI and on and on; most people have their preferred indicator that focuses on just that that they can use in conjunction.
The signals used can be grouped into two groups the 'Core Ichimoku Signals' & the 'Additional Signals' (at the end you will find the signals and their assigned weights followed by the thresholds where they align).
The Core Ichimoku Signals are the primary signals used in Ichimoku analysis, including Kumo Breakout, Chikou Cross, Kijun Cross, Tenkan Cross, and Kumo Twist.
While the Additional Signals provide further insights and confirmations, such as Kijun Confirmation, Tenkan-Kijun Above Cloud, Chikou Above Cloud, Price-Kijun Cross, Chikou Span Signal, and Price Positioning.
Entries are triggered when the cumulative weight of bullish signals exceeds a specified buy threshold, indicating a strong uptrend or potential trend reversal.
Exits are initiated when the cumulative weight of bearish signals surpasses a specified sell threshold, or when additional conditions such as consolidation patterns or ATR-based targets are met.
There are various exit types that you can choose between, which can be used separately or in conjunction with one another. As an example you might want to exit on a different condition during consolidation periods than during other periods or just use ATR with some other backstop.
They are listed in evaluation order i.e. ATR trumps all, Consolidation exit trumps the regular Kumo sell and so on:
**ATR Sell**: Exits trades based on ATR-based profit targets and stop-losses.
**Consolidation Exit**: Exits trades during consolidation periods to reduce drawdown.
**Sell Below Kumo**: Exits trades when the price is below the Kumo, indicating a potential downtrend.
**Sell Threshold**: Exits trades when the cumulative weight of bearish signals surpasses a specified sell threshold.
There are various 'filters' which are really behavior modifiers:
**Kumo Breakout Filter**: Requires price to close above the Kumo for buy signals (essentially a entry delay).
**Whipsaw Filter**: Ensures trend strength over specified days to reduce false signals.
**Buy Cooldown**: Prevents new entries until half the Kijun period passes after an exit (prevents flapping).
**Chikou Filter**: Delays exits unless the previous close is below the Chikou Span.
**Consolidation Trend Filter**: Prevents consolidation exits if the trend is bullish (rare, but happens).
Then there are some debugging options. Ichimoku periods have some presets (personally I like 8/22/44/22) but are freely configurable, preset to the traditional values for purists.
The list of signals and most thresholds follow, play around with them. Thats all.
Cheers,
**Core Ichimoku Signals**
**Kumo Breakout**
- 30 (Bullish) / -30 (Bearish)
- Indicates a strong trend when the price breaks above (bullish) or below (bearish) the Kumo (cloud). This signal suggests a significant shift in market sentiment.
**Chikou Cross**
- 20 (Bullish) / -20 (Bearish)
- Shows the relationship between the Chikou Span (lagging span) and the current price. A bullish signal occurs when the Chikou Span is above the price, indicating a potential uptrend. Conversely, a bearish signal occurs when the Chikou Span is below the price, suggesting a downtrend.
**Kijun Cross**
- 15 (Bullish) / -15 (Bearish)
- Signals trend changes when the Tenkan-sen (conversion line) crosses above (bullish) or below (bearish) the Kijun-sen (base line). This crossover is often used to identify potential trend reversals.
**Tenkan Cross**
- 10 (Bullish) / -10 (Bearish)
- Indicates short-term trend changes when the price crosses above (bullish) or below (bearish) the Tenkan-sen. This signal helps identify minor trend shifts within the broader trend.
**Kumo Twist**
- 5 (Bullish) / -5 (Bearish)
- Shows changes in the Kumo's direction, indicating potential trend shifts. A bullish Kumo Twist occurs when Senkou Span A crosses above Senkou Span B, and a bearish twist occurs when Senkou Span A crosses below Senkou Span B.
**Additional Signals**
**Kijun Confirmation**
- 8 (Bullish) / -8 (Bearish)
- Confirms the trend based on the price's position relative to the Kijun-sen. A bullish signal occurs when the price is above the Kijun-sen, and a bearish signal occurs when the price is below it.
**Tenkan-Kijun Above Cloud**
- 5 (Bullish) / -5 (Bearish)
- Indicates a strong bullish trend when both the Tenkan-sen and Kijun-sen are above the Kumo. Conversely, a bearish signal occurs when both lines are below the Kumo.
**Chikou Above Cloud**
- 5 (Bullish) / -5 (Bearish)
- Shows the Chikou Span's position relative to the Kumo, indicating trend strength. A bullish signal occurs when the Chikou Span is above the Kumo, and a bearish signal occurs when it is below.
**Price-Kijun Cross**
- 2 (Bullish) / -2 (Bearish)
- Signals short-term trend changes when the price crosses above (bullish) or below (bearish) the Kijun-sen. This signal is similar to the Kijun Cross but focuses on the price's direct interaction with the Kijun-sen.
**Chikou Span Signal**
- 10 (Bullish) / -10 (Bearish)
- Indicates the trend based on the Chikou Span's position relative to past price highs and lows. A bullish signal occurs when the Chikou Span is above the highest high of the past period, and a bearish signal occurs when it is below the lowest low.
**Price Positioning**
- 10 (Bullish) / -10 (Bearish)
- Shows indecision when the price is between the Tenkan-sen and Kijun-sen, indicating a potential consolidation phase. A bullish signal occurs when the price is above both lines, and a bearish signal occurs when the price is below both lines.
**Confidence Level**: Highly Sensitive
- **Buy Threshold**: 50
- **Sell Threshold**: -50
- **Notes / Significance**: ~2–3 signals, very early trend detection. High sensitivity, may capture noise and false signals.
**Confidence Level**: Entry-Level
- **Buy Threshold**: 58
- **Sell Threshold**: -58
- **Notes / Significance**: ~3–4 signals, often Chikou Cross or Kumo Breakout. Very sensitive, risks noise (e.g., false buys in choppy markets).
**Confidence Level**: Entry-Level
- **Buy Threshold**: 60
- **Sell Threshold**: -60
- **Notes / Significance**: ~3–4 signals, Kumo Breakout or Chikou Cross anchors. Entry point for early trends.
**Confidence Level**: Moderate
- **Buy Threshold**: 65
- **Sell Threshold**: -65
- **Notes / Significance**: ~4–5 signals, balances sensitivity and reliability. Suitable for moderate risk tolerance.
**Confidence Level**: Conservative
- **Buy Threshold**: 70
- **Sell Threshold**: -70
- **Notes / Significance**: ~4–5 signals, emphasizes stronger confirmations. Reduces false signals but may miss some opportunities.
**Confidence Level**: Very Conservative
- **Buy Threshold**: 75
- **Sell Threshold**: -75
- **Notes / Significance**: ~5–6 signals, prioritizes high confidence. Minimizes risk but may enter trades late.
**Confidence Level**: High Confidence
- **Buy Threshold**: 80
- **Sell Threshold**: -80
- **Notes / Significance**: ~6–7 signals, very strong confirmations needed. Suitable for cautious traders.
**Confidence Level**: Very High Confidence
- **Buy Threshold**: 85
- **Sell Threshold**: -85
- **Notes / Significance**: ~7–8 signals, extremely high confidence required. Minimizes false signals significantly.
**Confidence Level**: Maximum Confidence
- **Buy Threshold**: 90
- **Sell Threshold**: -90
- **Notes / Significance**: ~8–9 signals, maximum confidence level. Ensures trades are highly reliable but may result in fewer trades.
**Confidence Level**: Ultra Conservative
- **Buy Threshold**: 100
- **Sell Threshold**: -100
- **Notes / Significance**: ~9–10 signals, ultra-high confidence. Trades are extremely reliable but opportunities are rare.
**Confidence Level**: Extreme Confidence
- **Buy Threshold**: 110
- **Sell Threshold**: -110
- **Notes / Significance**: All signals align, extreme confidence. Trades are almost certain but very few opportunities.

FeraTrading Relative Volume IndicatorThis FeraTrading Relative Volume Indicator measures relative volume pressure by comparing buying and selling activity, smoothed using a configurable average. It helps traders identify volume-driven momentum shifts, offering dynamic buy and sell signals based on weighted pressure values.
Key Features:
📈 Relative Volume (RV) Line: Measures net buying/selling pressure using volume-weighted price action.
🟢 Buy Signals: Triggered when RV crosses above a smoothed moving average (SMA 1).
🔴 Sell Signals (optional): Triggered when RV crosses below a separate SMA (SMA 2).
🔍 Customizable Inputs: Adjust smoothing length, weight, and signal sensitivity.
🕯️ Weighted Candles (optional): Visualizes custom OHLC based on volume-weighted volatility.
📊 Two SMAs: Use separate or combined moving averages to analyze trends in pressure.
🎨 Flexible Styling: Customize line and signal colors to match your chart setup.
Use Cases:
Spotting accumulation/distribution phases
Timing entries during volume surges
Confirming breakout momentum with underlying volume pressure
This indicator was developed by FeraTrading to visualize relative volume pressure.

RSI VWAP POC [Uncle Sam Trading]Category: Oscillators, Volume, Market Profile
Timeframe: Suitable for all timeframes
Markets: Crypto, Forex, Stocks, Commodities
Overview
The RSI VWAP POC indicator is a powerful and innovative oscillator that combines the Relative Strength Index (RSI), Volume-Weighted Average Price (VWAP), and Point of Control (POC) from market profile analysis. Designed to provide traders with clear, high-probability trading signals, this indicator helps you identify key market levels, spot overbought/oversold conditions, and time your entries and exits with precision. Whether you’re a day trader, swing trader, or scalper, this free tool adds significant value to your trading strategy by offering a unique blend of momentum, volume, and market profile insights.
How It Works
This indicator integrates three core components to deliver actionable insights:
RSI (Relative Strength Index): Measures momentum to identify overbought (above 70) and oversold (below 30) conditions, helping you anticipate potential reversals.
VWAP (Volume-Weighted Average Price): Calculates a volume-weighted price benchmark, which is used to compute a more accurate, volume-sensitive RSI. This ensures the indicator reflects true market dynamics.
POC (Point of Control): Derived from market profile analysis, the POC represents the price level with the highest traded volume in a session, acting as a critical support or resistance level.
The indicator plots a smoothed RSI based on VWAP, overlaid with market profile data on a user-defined higher timeframe (default: 4H). The POC is displayed as a red line, with aqua bars indicating the value area where the majority of trading volume occurred. When the RSI crosses the POC, the indicator generates clear buy and sell signals:
Strong Buy (SBU): RSI crosses above the POC in an oversold zone.
Strong Sell (SBD): RSI crosses below the POC in an overbought zone.
Additional features include:
Background colors to highlight bullish (green) or bearish (red) trends.
Shaded zones for overbought (70/60) and oversold (30/40) levels.
Customizable settings to fit your trading style and timeframe.
How This Indicator Adds Value
The RSI VWAP POC indicator offers several key benefits that enhance your trading performance:
High-Probability Signals: By combining RSI, VWAP, and POC, this indicator identifies trades at key market levels where price is likely to react, increasing your win rate.
Improved Timing: Clear buy and sell signals, such as ‘SBU’ and ‘SBD’, help you enter and exit trades at optimal points, maximizing profitability.
Risk Management: Overbought/oversold zones and trend confirmation via background colors help you avoid false signals, protecting your capital.
Versatility: Suitable for all markets (crypto, forex, stocks) and timeframes, making it a valuable tool for traders of all experience levels.
Time Efficiency: The indicator does the heavy lifting by analyzing momentum, volume, and market profile data, allowing you to focus on executing trades.
Real-World Performance Example: On a 1-hour Bitcoin chart with a 4-hour higher timeframe, this indicator identified a strong sell signal on April 6th at 12:00 ($82,000), leading to a 9% drop to $74,600. A subsequent strong buy signal on April 7th at 04:00 ($76,200) captured a 6% rise to $81,200 – a potential 25% profit with 5x leverage if exited at 5%.
How to Use
Add the Indicator: Search for “RSI VWAP POC ” in TradingView’s indicator library and add it to your chart.
Set Your Timeframe: The indicator works on any timeframe but is optimized for a 1-hour chart with a 4-hour higher timeframe (set in the settings).
Interpret Signals:
Look for ‘SBU’ (strong buy) labels when the RSI crosses above the POC in an oversold zone, indicating a potential buying opportunity.
Look for ‘SBD’ (strong sell) labels when the RSI crosses below the POC in an overbought zone, signaling a potential selling opportunity.
Use the background colors (green for bullish, red for bearish) to confirm the trend.
Combine with Your Strategy: Use the indicator alongside your existing analysis (e.g., support/resistance, candlestick patterns) for best results.
Settings and Customization
The indicator is highly customizable to suit your trading needs:
RSI Length (Default: 14): Adjust the sensitivity of the RSI. Use a shorter length (e.g., 10) for scalping, or a longer length (e.g., 20) for smoother signals.
EMA Smoothing Length (Default: 3): Smooths the RSI line. Increase to 5 or 7 for less choppy signals in volatile markets.
Higher Timeframe (Default: 240 minutes): Set to 240 (4 hours) for a 1-hour chart. Adjust based on your chart’s timeframe (e.g., 60 minutes for a 15-minute chart).
Value Area Percentage (Default: 100%): Defines the size of the value area around the POC. Lower to 70% for a tighter focus on key levels.
Overbought/Oversold Thresholds (Defaults: 70/30): Adjust these levels to match market conditions (e.g., 80/20 for trending markets).
Show POC Line (Default: True): Toggle the red POC line on or off.
Show Buy/Sell Signals: Enable ‘Show Strong Breakup Signals’ and ‘Show Strong Breakdown Signals’ to focus on high-probability trades.
Why Choose This Indicator?
The RSI VWAP POC indicator stands out by offering a unique combination of momentum, volume, and market profile analysis in a single, easy-to-use tool. It’s designed to help traders of all levels make informed decisions, reduce risk, and increase profitability. Whether you’re trading Bitcoin, forex pairs, or stocks, this indicator provides the clarity and precision you need to succeed.

Gann Percentage of High & Low Prices for Options - Keanu_RiTzThis Indicator is based on the text from Chapter 4 "Percentage of High & Low Prices" page number "30" from the book "WD Gann 45 years in Wall Street".
This Indicator is to be used on Intraday Timeframes and only on Options Charts (CALL & PUT) and not on any other chart.
The following is the text from that page :-
One of the greatest discoveries I ever made was how to figure the percentage of high and low prices on the averages and individual stocks.
The percentages of extreme high and low levels indicate future resistance levels.
There is a relation between every low price to some future high price and a percentage of the low price indicates what levels to expect the next high price.
At this price you can sell out long stocks and sell short with a limited risk.
The extreme high price or any minor tops are related to future bottoms er low levels.
The percentage of the high price tells where to expect low prices in the future and gives you resistance levels where you can buy with a limited risk.
The most important resistance level is 50% of any high or low price.
Second in importance is 100% on the lowest selling price on the averages or individual stocks.
You must also use 200%, 300%, 400%, 500%, 600% or more, depending upon the price and the Time Periods from High and Low.
Third in importance is 25% of the Lowest price or the Highest price.
Fourth in importance is 121/2% of the extreme Low or extreme High price.
Fifth in importance is 61/4% of the Highest price, but this is only to be used when the averages or individual stocks are selling at very high levels.
Sixth in importance is 33 1/3 and 66 2/3%. These percentages should be calculated and watched for resistance next after 25% and after 50%.
You should always have percentage tables made up on the Industrial Averages and on the individual stocks you trade in in order to know where these important resistance levels are located.
Description :
It plots the Intraday % levels from the highest high and lowest low of that day.
The calculation of these levels is based on the text from Chapter 4 "Percentage of High & Low Prices" page number "30" from the book "WD Gann 45 years in Wall Street".
I developed this indicator to see if those percentages work on Options prices or not,
and from my observation I found that it works wonderfully in Options as well.
These % levels work like magic and act as great Dynamic Support and Resistance levels.
Don't trust my words blindly and see for yourself.
This indicator is for educational and research purpose only.
It does not provide any BUY/SELL signals.

McClellan Oscillator - IRUS Optimized🧠 McClellan Oscillator (IRUS Index)
Type: Market Breadth Indicator
Category: Breadth, Momentum
Purpose: Gauge the internal strength of the IRUS index and anticipate trend reversals
📌 Based on
This indicator is built on the concept of advancing vs. declining issues — the number of stocks rising vs. falling each day within the IRUS index (a custom group of 40 Russian stocks).
It calculates the net advances (advancers minus decliners), then applies two exponential moving averages (EMA):
java
Copy
Edit
McClellan Oscillator = EMA_19(Net Advances) - EMA_39(Net Advances)
Where:
Net Advances = Number of advancing stocks - Number of declining stocks
Calculated from a fixed set of 40 IRUS stocks
🧭 What it shows
Above 0 → more stocks are rising: market is internally strong.
Below 0 → more stocks are falling: underlying weakness.
Rising from below -100 → oversold breadth, possible bullish reversal.
Falling from above +100 → overbought breadth, possible correction.
🎯 How to use it
1. Buy/Sell Signals
Buy: Oscillator drops below -100 and turns up → oversold, potential rally.
Sell: Oscillator rises above +100 and turns down → overbought, risk of pullback.
2. Trend Strength Confirmation
Sustained above 0 → confirms bullish trend.
Crosses below 0 → early warning of weakening market breadth.
3. Divergences with IRUS Price
IRUS rises, but Oscillator falls → narrowing leadership, bearish divergence.
IRUS falls, but Oscillator rises → improving breadth, bullish divergence.
⚠️ Notes
The oscillator measures participation, not price.
Works best with daily timeframe.
Does not account for volume or magnitude of price moves.
Use with price action or other indicators for confirmation.
⚙️ Custom Implementation
This version is specifically adapted for the IRUS index, using a fixed list of 40 component stocks.
Optimized for Pine Script v6 and complies with TradingView's request limits (max 40).

5-Min First Candle Breakout/BreakdownAwesome! Here's a basic Pine Script (v5) for a First 5-minute candle breakout/breakdown strategy with Buy/Sell signals and price labels. This script works by capturing the high and low of the first candle of the session and then showing signals when those levels are broken.
You can customize it further for Entry, Stop Loss, Target, etc., but this gives you the foundation with labels for buys/sells based on breakout/breakdown.

Dual RSI SmootherUltimator's Dual RSI Smoother
Description:
The Dual RSI Smoother is a momentum-based indicator that applies two smoothed and amplified RSI calculations to analyze potential trend reversals and overbought/oversold conditions. By utilizing two separate RSI lengths and smoothing parameters, this tool provides a refined view of price momentum and potential trading signals.
Features:
Dual RSI Calculation – Computes two RSI values with separate user-defined lengths.
Smoothing & Amplification – Applies SMA-based smoothing and an amplification factor to enhance signal clarity.
Dynamic Line Colors – Adjusts colors based on RSI interactions to visually highlight important conditions.
Buy & Sell Signals – Displays buy dots when oversold conditions are detected and sell dots in overbought zones.
How to Use:
Buy Signals: Green dots appear when RSI conditions indicate an oversold market, suggesting a potential buying opportunity.
Sell Signals: Red dots appear when RSI conditions indicate an overbought market, suggesting a potential selling opportunity.
Trend Confirmation: The indicator’s smoothed RSI lines can help identify sustained trends when they diverge or cross.
User Inputs:
RSI Length 1 & 2: Adjusts the calculation periods for the two RSI values.
Line Colors: Customizable colors for fast and slow RSI lines.
Highlight Colors: Custom color for buy signal highlights.
Buy & Sell Dot Colors: Customizable colors for buy and sell signal markers.
Best Use Cases:
Identifying early reversals in overbought/oversold market conditions.
Confirming trend strength through smoothed RSI interactions.
Enhancing trade entries by aligning buy/sell signals with other momentum indicators.

BBVOL SwiftEdgeBBVOL SwiftEdge – Precision Scalping with Volume and Trend Filtering
Optimized for scalping and short-term trading on fast-moving markets (e.g., 1-minute charts), BBVOL SwiftEdge combines Bollinger Bands, Heikin Ashi smoothing, volume momentum, and EMA trend alignment to deliver actionable buy/sell signals with visual trend cues. Ideal for forex, crypto, and stocks.
What Makes BBVOL SwiftEdge Unique?
Unlike traditional Bollinger Bands scripts that focus solely on price volatility, BBVOL SwiftEdge enhances signal precision by:
Using Heikin Ashi to filter out noise and confirm trend direction, reducing false signals in choppy markets.
Incorporating volume analysis to ensure signals align with significant buying or selling pressure (customizable thresholds).
Adding an EMA overlay to keep trades in sync with the short-term trend.
Coloring candlesticks (green for bullish, red for bearish, purple for consolidation) to visually highlight market conditions at a glance.
How Does It Work?
Buy Signal: Triggers when price crosses above the lower Bollinger Band, Heikin Ashi shows bullish momentum (close > open), buy volume exceeds your set threshold (default 30%), and price is above the EMA. A green triangle appears below the candle.
Sell Signal: Triggers when price crosses below the upper Bollinger Band, Heikin Ashi turns bearish (close < open), sell volume exceeds the threshold (default 30%), and price is below the EMA. A red triangle appears above the candle.
Trend Visualization: Candles turn green when price is significantly above the Bollinger Bands’ basis (indicating a bullish trend), red when below (bearish trend), or purple when near the basis (consolidation), based on a customizable threshold (default 10% of BB width).
Risk Management: Each signal calculates a stop-loss (10% beyond the opposite band) and take-profit (opposite band), plotted for reference.
How to Use It
Timeframe: Best on 1-minute to 5-minute charts for scalping; test higher timeframes for swing trading.
Markets: Works well in volatile markets like forex pairs (e.g., EUR/USD), crypto (e.g., BTC/USD), or liquid stocks.
Customization: Adjust Bollinger Bands length (default 10), multiplier (default 1.2), volume thresholds (default 30%), EMA length (default 3), and consolidation threshold (default 0.1%) to match your strategy.
Interpretation: Look for green/red triangles as entry signals, confirmed by candle colors. Purple candles suggest caution—wait for a breakout. Use stop-loss/take-profit levels for trade management.
Underlying Concepts
Bollinger Bands: Measures volatility and identifies overbought/oversold zones.
Heikin Ashi: Smooths price action to emphasize trend direction.
Volume Momentum: Calculates cumulative buy/sell volume percentages to confirm market strength (e.g., buyVolPercent = buyVolume / totalVolume * 100).
EMA: A fast-moving average (default length 3) ensures signals align with the immediate trend.
Chart Setup
The chart displays Bollinger Bands (orange), Heikin Ashi close (green circles), EMA (purple), and volume-scaled lines (lime/red). Signals are marked with triangles, and candle colors reflect trend state. Keep the chart clean by focusing on these outputs for clarity.

RG - Volume Spike DetectorRG - Volume Spike Detector is a comprehensive volume analysis tool designed to help traders identify significant volume activity across different tickers on TradingView. This indicator not only detects overall volume spikes and percentage changes but also approximates and analyzes buying and selling volume separately, providing valuable insights into market dynamics. With customizable parameters, visual cues, and built-in alerts, it's suitable for traders of all levels looking to monitor volume-based market movements.
Features
Volume Spike Detection:
Identifies when total volume exceeds a user-defined multiple of its moving average (default: 2x).
Separate detection for buying and selling volume spikes based on their respective moving averages.
Volume Change Analysis:
Calculates and displays the percentage change in total volume from the previous bar.
Highlights significant increases (>50%) or decreases (<-50%) with alert options.
Buy/Sell Volume Approximation:
Estimates buying and selling volume using price movement and range:
Up bars: Buying volume ≈ volume * (close - low)/(high - low)
Down bars: Selling volume ≈ volume * (close - low)/(high - low)
Handles edge cases (e.g., high = low) to ensure accurate calculations.
Ideal For
Day traders monitoring sudden volume surges
Swing traders analyzing volume trends
Market analysts studying buying vs. selling pressure
This indicator empowers traders with a robust tool to track volume dynamics, offering both visual clarity and actionable alerts for informed decision-making.

Volume Delta Imbalance Index [PhenLabs]📊 Volume Delta Imbalance Index (VDII)
Version: PineScript™ v6
Description
The Volume Delta Imbalance Index is an advanced technical analysis tool that combines volume profile analysis with price movement dynamics to identify significant market imbalances. It features a sophisticated analysis system that weighs recent versus historical volume delta imbalance patterns, providing traders with insights into potential market reversals and trend continuation scenarios.
Points of Innovation:
Custom volume delta calculation incorporating price and volume relationships
Adaptive smoothing system based on market volatility
Multi-component analysis combining flow, acceleration, and strength metrics
Real-time volume profile integration with historical context
🔧 Core Components
Volume Profile Analysis: Dynamic volume delta imbalance distribution assessment
Flow Imbalance Detection: Buy/sell pressure evaluation
Strength Analysis: Composite market strength measurement
Acceleration Framework: Volume movement dynamics
Statistical Bands: Adaptive threshold system
🚨 Key Features 🚨
The indicator provides comprehensive analysis through:
Volume Delta: Up to date volume imbalance measurement
Market Structure: Support/resistance level identification
Flow Analysis: Buy/sell pressure visualization
Acceleration Signals: Movement momentum detection
Adaptive Bands: Dynamic overbought/oversold levels
📈 Visualization
Color-coded Columns: Shows direction and strength of imbalance
Signal Lines: Strong buy/sell level indicators
Statistical Bands: Shows normal trading ranges
Gradient Fills: Indicates extreme market conditions
Dynamic Opacity: Reflects trend strength
📌 Usage Guidelines
The indicator offers several customization options:
Basic Settings:
Lookback Period: Analysis timeframe adjustment
Sensitivity Level: Signal response calibration
History Depth: Historical context range
Memory Setting: Recent vs. historical data weight
Visual Settings:
Color Scheme: Bullish/bearish signal colors
Signal Levels: Strong buy/sell thresholds
Band Display: Statistical range visualization
✅ Best Use Cases / Things To Look For:
Wait for establishment in the initial trend when the VDII comes back towards zero and the color of the volume becomes more faint
Once this is established and the VDII pushes through to the other side look for small retracements above the zero line on the VDII leading you to believe it is a likely area for price to retrace and continue in its prior direction
Make sure you see the volume bars become more faint in color to give yo further confluence price will continue in its priorly established direction
⚠️ Limitations
Requires sufficient volume data
Most effective in liquid markets
Historical depth affects calculation speed
Possible lag in highly volatile conditions
What Makes This Unique
Composite Volume Analysis: Combines multiple volume metrics
Adaptive Calculation: Adjusts to market volatility
Profile Integration: Incorporates volume profile analysis
Multi-component Scoring: Weighted analysis system
Memory-efficient Design: Optimized for real-time analysis
🔧 How It Works
The indicator processes market data through four main components:
1. Volume Profile Analysis:
Creates dynamic volume delta distribution profiles
Weights recent versus historical data
Identifies significant price levels
2. Flow Imbalance Detection:
Analyzes buying versus selling pressure
Calculates normalized flow ratios
Determines market bias
3. Strength Analysis:
Measures composite market strength
Incorporates volume-weighted movements
Provides trend strength indication
4. Final Score Calculation:
Combines all components with weighted importance
Applies volatility-based smoothing
Generates final signal output
5. VDII Potential Reversal Confluences
Bars between signal confluence is default set to 10 but you can change it to whatever you’d prefer
Signals are a compiled look at the indicator as a whole determining where it think reversals or retracements are likely
💡 Note:
The indicator performs best in markets with consistent volume and clear trending or ranging conditions. Its sophisticated volume analysis provides valuable insights into market dynamics beyond traditional price-based indicators.

SatoshiSteps Swing StrategyCore Components:
The indicator combines three popular technical analysis tools:
Ichimoku Cloud: This helps identify the trend, support, and resistance levels.
RSI (Relative Strength Index): This momentum oscillator identifies overbought and oversold conditions.
MACD (Moving Average Convergence Divergence): This trend-following momentum indicator shows the relationship between two moving averages1 of prices.
Logic:
The strategy aims to identify potential swing trading opportunities by combining signals from these three components. It essentially looks for:
Trend Confirmation (Ichimoku):
Price should be above the Ichimoku cloud for buy signals.
Price should be below the Ichimoku cloud for sell signals.
The Tenkan-sen (conversion line) should cross above the Kijun-sen (base line) for buy signals.
The Tenkan-sen should cross below the Kijun-sen for sell signals.
Overbought/Oversold Conditions (RSI):
RSI should be below the overbought level for buy signals (avoiding buying when the market is potentially overextended).
RSI should be above the oversold level for sell signals (avoiding selling when the market is potentially oversold).
Momentum Confirmation (MACD):
The MACD line should be above the signal line for buy signals (indicating upward momentum).
The MACD line should be below the signal line for sell signals (indicating downward momentum).
Buy Signal:
A buy signal is generated when all the following conditions are met:
The Tenkan-sen crosses above the Kijun-sen.
The price is above both the Senkou Span A and Senkou Span B (the cloud).
The RSI is below the overbought level.
The MACD line is above the signal line.
Sell Signal:
A sell signal is generated when all the following conditions are met:
The Tenkan-sen crosses below the Kijun-sen.
The price is below both the Senkou Span A and Senkou Span B (the cloud).
The RSI is above the oversold level.
The MACD line is below the signal line.
Key Considerations:
Time Frame: The indicator has built-in adjustments for 1-hour and 4-hour timeframes, optimizing the parameters for each.
Customization: You can customize the overbought/oversold RSI levels and the styles of the buy/sell signals (triangle, label, arrow, circle) through the indicator's settings.
Accuracy: While the strategy combines multiple indicators to improve accuracy, remember that no trading indicator is perfect. Market conditions can change rapidly, and false signals can occur.
Risk Management: Always use proper risk management techniques, such as stop-loss orders, and never risk more than you can afford to lose.

RoGr75 Adaptive EMA CrossDescription:
The RoGr75 Adaptive EMA Cross indicator dynamically combines exponential moving averages (EMAs) with ATR-based volatility buffers to generate buy and sell signals across multiple timeframes. This script uses customizable settings for short and long EMAs, ATR, and volume filters, ensuring that signals are both volatility-adjusted and timeframe-aware. It includes features such as adaptive buffers, distinct price level filters for buying and selling, and a reset mechanism to prevent redundant signals. Additionally, the indicator manages signal labels efficiently to keep your chart uncluttered.
Warning:
This script is provided for testing and educational purposes only. It is not intended as financial advice, and past performance does not guarantee future results. Use at your own risk. Always conduct your own research before making any trading decisions.
Higher Timeframe Input: Choose a specific timeframe for the indicator’s calculations; leave blank to use the chart’s current timeframe.
Signal Distance: Sets the distance of signal labels from the candles as a multiple of the ATR.
Exact Value Offset: Adjusts the secondary marker’s position for precision on the chart.
ATR Length: Defines the period used to calculate the Average True Range for volatility measurement.
EMA Lengths: Specify the periods for the short and long exponential moving averages.
Buy/Sell Buffer ATR Multipliers: Dynamically adjust the trigger distance beyond the EMA crossovers based on volatility.
Price Level Filter: Activates a filter so that buy signals only occur above a set price and sell signals only occur below that price (0 disables the filter).
Volume Filter: Optionally requires current volume to exceed a set multiple of a 20-period average for signal confirmation.
Reset Period: Resets the last signal memory after a specified number of bars to avoid suppressing valid repeat signals.
EMA Colors & Line Width: Customize the appearance of the short and long EMAs.
Label Colors & Styles: Choose colors, text colors, and styles for the buy and sell signal labels.
Background Highlighting: Optionally colors the background when a buy or sell signal occurs.
Label Management: Automatically removes the oldest labels when a set maximum is reached to keep the chart clean.
Alerts: Predefined conditions allow you to set TradingView alerts when buy or sell signals are generated.
Warning: This indicator is for testing purposes only and is not financial advice. Use it at your own risk.

Reversal rehersal v1This indicator was designed to identify potential market reversal zones using a combination of RSI thresholds (shooting range/falling range), candlestick patterns, and Fair Value Gaps (FVGs). By combining all these elements into one indicator, it allow for outputting high probability buy/sell signals for use by scalpers on low timeframes like 1-15 mins, for quick but small profits.
Note: that this has been mainly tested on DE40 index on the 1 min timeframe, and need to be adjusted to whichever timeframe and symbol you intend to use. Refer to the backtester feature for checking if this indicator may work for you.
The indicator use RSI ranges from two timeframes to highlight where momentum is building up. During these areas, it will look for certain candlestick patterns (Sweeps as the primary one) and check for existance of fair value gaps to further enhance the hitrate of the signal.
The logic for FVG detection was based on ©pmk07's work with MTF FVG tiny indicator. Several major changes was implemented though and incorporated into this indicator. Among these are:
Automatically adjustments of FVG boxes when mitigated partially and options to extend/cull boxes for performance and clarity.
Backtesting Table (Experimental):
This indicator also features an optional simplified table to review historical theoretical performance of signals, including win rate, profit/loss, and trade statistics. This does not take commision or slippage into consideration.
Usage Notes:
Setup:
1. Add the indicator to your chart.
2. Decide if you want to use Long or Short (or both).
3. If you're scalping on ie. 1 min time frame, make sure to set FVG's to higher timeframes (ie. 5, 15, 60).
4. Enable the 'Show backtest results' and adjust the 'Signals' og 'Take profit' and 'Stop loss' values until you are satisfied with the results.
Use:
1. Setup an alert based on either of the 'BullishShooting range' or 'BearishFalling range' alerts. This will draw your attention to watch for the possible setups.
2. Verify if there's a significant imbalance prior to the signal before taking the trade. Otherwise this may invalidate the setup.
3. Once a signal is shown on the graph (either Green arrow up for buys/Red arrow down for sells) - you should enter a trade with the given 'Take profit' and 'Stop loss' values.
4. (optional) Setup an alert for either the Strong/Weak signals. Which corresponds to when one of the arrows are printed.
Important: This is the way I use it myself, but use at own risk and remember to combine with other indicators for further confluence. Remember this is no crystal ball and I do not guarantee profitable results. The indicator merely show signals with high probability setups for scalping.

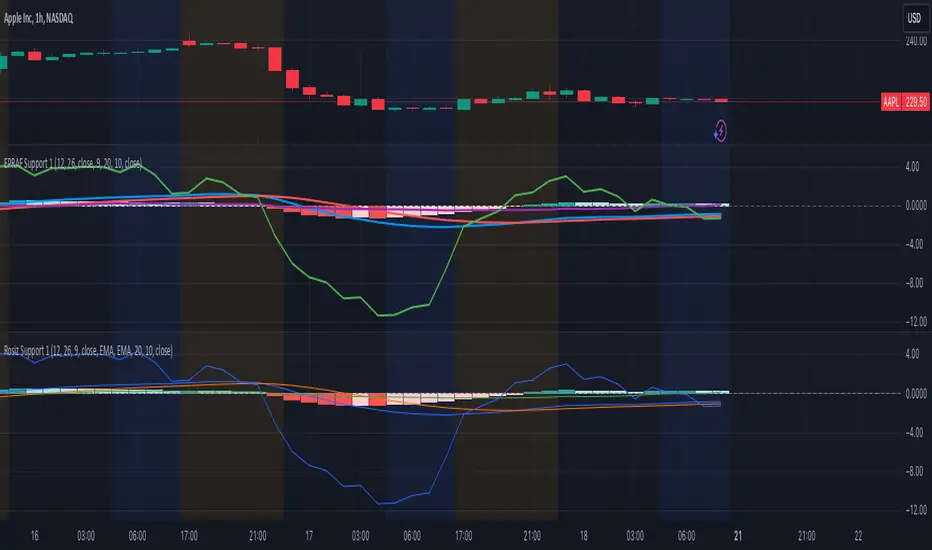
Rosiz Support 1### Description of the Custom Indicator: MACD + CMF + MOM
This custom indicator combines three powerful technical analysis tools: **MACD (Moving Average Convergence Divergence)**, **CMF (Chaikin Money Flow)**, and **MOM (Momentum)**, to provide a comprehensive view of market trends, momentum, and money flow in a single pane. Here's what each component offers:
---
#### 1. **MACD (Moving Average Convergence Divergence)**
The **MACD** is a trend-following momentum indicator that shows the relationship between two moving averages of an asset’s price.
- **Purpose**: Identifies trend direction and momentum strength.
- **Key Components**:
- **MACD Line**: Difference between the fast and slow exponential moving averages (EMA).
- **Signal Line**: A smoothed moving average of the MACD line, acting as a trigger for buy/sell signals.
- **Histogram**: The difference between the MACD line and the signal line. Positive values indicate bullish momentum, while negative values indicate bearish momentum.
- **Usage**: Look for crossovers (MACD crossing the signal line) to identify potential trend changes.
---
#### 2. **CMF (Chaikin Money Flow)**
The **CMF** measures the volume-weighted average of accumulation and distribution over a specific period. It shows whether money is flowing into or out of an asset.
- **Purpose**: Detects buying or selling pressure based on price and volume.
- **Key Components**:
- **Positive CMF**: Indicates that the asset is being accumulated (buying pressure).
- **Negative CMF**: Indicates that the asset is being distributed (selling pressure).
- **Usage**: Values above 0 suggest bullish strength, while values below 0 suggest bearish strength.
---
#### 3. **MOM (Momentum)**
The **Momentum Indicator** measures the rate of change of an asset's price over a specified period. It helps traders identify the speed of price movements.
- **Purpose**: Highlights the strength and direction of price momentum.
- **Key Components**:
- **Momentum Line**: Positive values indicate upward momentum, while negative values indicate downward momentum.
- **Usage**: A rising momentum line suggests strengthening price trends, while a falling line indicates weakening trends.
---
### Benefits of Combining These Indicators:
1. **Trend Confirmation**: MACD provides a clear picture of trend direction and potential reversals.
2. **Volume-Based Insights**: CMF adds a layer of confirmation by analyzing money flow based on price and volume.
3. **Momentum Analysis**: MOM reveals the speed and strength of price movements, helping traders confirm breakouts or trend exhaustion.
4. **Enhanced Decision-Making**: The combination of these indicators allows traders to make more informed decisions by evaluating different aspects of market behavior in one pane.
---
### How to Use:
- **Identify Trends**: Use MACD to identify overall trend direction and reversals.
- **Confirm Momentum**: Check MOM to validate the strength of the trend.
- **Gauge Buying/Selling Pressure**: Refer to CMF to confirm whether the price movement is backed by accumulation or distribution.
- **Entry/Exit Points**: Look for MACD crossovers, CMF shifts above/below zero, and momentum changes to refine entry and exit strategies.
This powerful tool integrates the strengths of three indicators, making it ideal for traders looking to analyze market conditions holistically and improve their timing and accuracy.
Volume EquilibriumThe intent behind this indicator is to provide comprehensive information relating to volume compared to multiple timeframes. This indicator allows one to see what the market 'theoretically' sees as 'fair-value' whilst also allowing one to gauge where the price of a stock is headed.
Volume Equilibrium
The main indicator finds the difference between buying volume and selling volume, under the basic presumption that more buying volume indicates greater bullish sentiment and vice versa.
Buying Volume = volume when close price is higher than open price.
Selling Volume = volume when close price is lower than open price.
Volume Balance = Cumulative Buying Volume − Cumulative Selling Volume
Volume Balance is then expressed as a percentage by dividing by total volume
This indicator is composed of three different lengths of the same indicator. Short, Mid, and Long term representations of Volume Equilibrium. The difference between the mid and long term are highlighted so to make it easy to see where volume is going relative to a longer time frame.
HOW TO USE:
At 0 ---> Equilibrium ---> Equal Buying/Selling Volume
Above 0 ---> More buying Volume
Below 0 ---> More selling Volume
Using theory, it is assumed that the price is at a 'fair-value' when the buying/selling volume is at 0. This is of course relative to the respective timeframe of your choosing. More weight given to larger timeframes.
Volume Histogram
It is a basic volume chart that represents the total volume though has highlighted bars so to indicate buying(green) and selling(red) volume. This allows one to see what the indicator is based off of.
Open-Close Oscillator(not needed)
Calculates the average open-close for a selected timeframe and then provides the current closing price relative to that average open-close. Very simply put, values below 0 indicate bearish and values above 0 generally indicate bullishness. This indicator is for a quick reference of price action relative to volume.
Another way to use this indicator, though unique, is to analyze the separate open-close lines themselves. Using the open-close bands, bullishness is defined as increasing closing prices and bearish as decreasing closing prices. So, in regard to this indicator, bear sessions can be indicated by the opening line being below the closing line and bull sessions as the opening line being above. Use the 'flip' of these lines to your advantage, they are very helpful at capturing long continuous sentiment.
This indicator is composed of great information though I still think it best to use many different indicators to help you with your trades.
NOTE: Be aware of what we are trying to analyze, Volume. This means that one should also look out for divergences to capture early indications of reversals. This indicator can be leveraged greatly.

Uptrick: Arbitrage OpportunityINTRODUCTION
This script, titled Uptrick: Arbitrage Monitor, is a Pine Script™ indicator that aims to help traders quickly visualize potential arbitrage scenarios across multiple cryptocurrency exchanges. Arbitrage, in general, involves taking advantage of price differences for the same asset across different trading platforms. By comparing market prices of the same symbol on two user-selected exchanges, as well as scanning a broader list of exchanges, this script attempts to signal areas where you might want to buy on one exchange and sell on another. It includes various graphical tools, calculations, and an optional Automated Detection signal feature, allowing users to incorporate more advanced data scanning into their trading decisions. Keep in mind that transaction fees must also be considered in real-world scenarios. These fees can negate potential profits and, in some cases, result in a net loss.
PURPOSE
The primary purpose of this indicator is to show potential percentage differences between the same cryptocurrency trading pairs on two different exchanges. This difference is displayed numerically, visually as a line chart, and it is also tested against user-defined thresholds. With the threshold in place, buy and sell signals can be generated. The script allows you to quickly gauge how significant a spread is between two exchanges and whether that spread surpasses a specified threshold. This is particularly useful for arbitrage trading, where an asset is bought at a lower price on one exchange and sold at a higher price on another, capitalizing on price discrepancies. By identifying these opportunities, traders can potentially secure profits across different markets.
WHY IT WAS MADE
This script was developed to help traders who frequently look for arbitrage opportunities in the fast-paced cryptocurrency market. Cryptocurrencies sometimes experience quick price divergences across different exchanges. By having an automated approach that compares and displays prices, traders can spend less time manually tracking price discrepancies and more time focusing on actual trading strategies. The script was also made with user customization in mind, allowing you to toggle an optional Automated-based approach and choose different moving average methods to smooth out the displayed price difference.
WHAT ARBITRAGE IS
Arbitrage is the practice of buying an asset on one market (or exchange) at a lower price and simultaneously selling it on another market where the price is higher, thus profiting from the price difference. In cryptocurrency markets, these price differentials can occur across multiple exchanges due to varying liquidity, trading volume, geographic factors, or market inefficiencies. Though sometimes small, these differences can be exploited for profit when approached methodically.
EXPLANATION OF INPUTS
The script includes a variety of user inputs that help tailor the indicator to your specific needs:
1. Compared Symbol 1: This is the primary symbol you want to track (for example, BTCUSDT). Make sure it's written in all capital and make sure that it's price from that exchange is available on Tradingview.
2. Compare Exchange 1: The first exchange on which the script will request pricing data for the chosen symbol.
3. Compared to Exchange: The second exchange, used for the comparison.
4. Opportunity Threshold (%): A percentage threshold that, when exceeded by the price difference, can trigger buy or sell signals.
5. Plot Style?: Allows you to choose between plotting the raw difference line or a moving average of that difference.
6. MA Type: Select among SMA, EMA, WMA, RMA, or HMA for your moving average calculation.
7. MA Length: The lookback period for the selected moving average.
8. Plot Buy/Sell Signals?: Enables or disables the plotting of arrows signaling potential buy or sell zones based on threshold crossovers.
9. Automated Detection?: Toggles an additional multi-exchange data scan feature that calculates the highest and lowest prices for the specified symbol across a predefined list of exchanges.
CALCULATIONS
At its core, the script calculates price1 and price2 using the request.security function to fetch close prices from two selected exchanges. The difference is measured as (price1 - price2) / price2 * 100. This results in a percentage that indicates how much higher or lower price1 is relative to price2. Additionally, the script calculates a slope for this difference, which helps color the line depending on whether it is trending up or down. If you choose the moving average option, the script will replace the raw difference data with one of several moving average calculations (SMA, EMA, WMA, RMA, or HMA).
The script also includes an iterative scan of up to 15 different exchanges for Automated detection, collecting the highest and lowest price across all those exchanges. If the Automated option is enabled, it compiles a potential recommendation: buy at the cheapest exchange price and sell at the most expensive one. The difference across all exchanges (allExDiffPercent) is calculated using (highestPriceAll - lowestPriceAll) / lowestPriceAll * 100.
WHAT AUTOMATED DETECTION SIGNAL DOES
If enabled, the Automated detection feature scans all 15 supported exchanges for the specified symbol. It then identifies the exchange with the highest price and the exchange with the lowest price. The script displays a recommended action: buy on the lowest-exchange price and sell on the highest-exchange price. While called “Automated,” it is essentially a multi-exchange data query that automates a portion of research by consolidating different price points. It does not replace thorough analysis or guaranteed execution; it simply provides an overview of potential extremes.
WHAT ALL-EX-DIFF IS
The variable allExDiffPercent is used to show the overall difference between the highest price and the lowest price found among the 15 pre-chosen exchanges. This figure can be useful for anyone wanting a big-picture view of how large the arbitrage spread might be across the broader market.
SIGNALS AND HOW THEY ARE GENERATED
The script provides two main modes of signal generation:
1. Raw Difference Mode: If the user chooses “Use Normal Line,” the script compares the percentage difference of the two selected exchanges (price1 and price2) to the user-defined threshold. When the difference crosses under the positive threshold, a sell signal is displayed (red arrow). Conversely, when the difference crosses above the negative threshold, a buy signal is displayed (green arrow).
2. Moving Average Mode: If the user selects “Use Moving Average,” the script instead references the moving average values (maValue). The signals fire under similar conditions but use the average line to gauge whether the threshold has been crossed.
HOW TO USE THE INDICATOR
1. Add the script to your chart in TradingView.
2. In the script’s settings panel, configure the symbol you wish to compare (for example, BTCUSDT), choose the two exchanges you want to evaluate, and set your desired threshold.
3. Optionally, pick a moving average type and length if you prefer a smoother representation of the difference.
4. Enable or disable buy/sell signals according to your preference.
5. If you’d like to see potential extremes among a broader list of exchanges, enable Automated Detection. Keep in mind that this feature runs additional security requests, so it might slow down performance on weaker devices or if you already have many scripts running.
EXCHANGES TO USE
The script currently supports up to 15 exchanges: BYBIT, BINANCE, MEXC, BLOFIN, BITGET, OKX, KUCOIN, COINBASE, COINEX, PHEMEX, POLONIEX, GATEIO, BITSTAMP, and KRAKEN. You can choose any two of these for direct comparison, and if you enable the Automated detection, it will attempt to query them all to find extremes in real time.
VISUALS
The exchanges and current prices & differences are all plotted in the table while the colored line represents the difference in the price. The two thresholds colored red are where signals are generated. A cross below the upper threshold is a sell signal and a cross above the lower threshold is a buy signal. In the line at the bottom, purple is a negative slope and aqua is a positive slope.
LIMITATIONS AND POTENTIAL PROBLEMS
If you enable too many visual elements such as signals, additional lines, and the Automated-based scanning table, you may find that your chart becomes cluttered, or text might overlap. One workaround is to remove and reapply the indicator to refresh its display. You may also want to reduce the number of displayed table rows by disabling some features if your chart becomes too crowded. Sometimes there might be an error that the price of an asset is not available on an exchange, to fix this, go and select another exchange to compare it to, or if it happens in Automated detection, choose a different asset, ideally more widely spread.
UNIQUENESS
This indicator stands out due to its multifaceted approach: it doesn’t just look at two exchanges but optionally scans up to 15 exchanges in real time, presenting users with a much broader view of the market. The dual-mode system (raw difference vs. moving average) allows for both immediate, unfiltered signals and smoother, noise-reduced signals depending on user preference. By default, it introduces dynamic visual cues through color changes when the slope of the difference transitions upward or downward. The optional Automated detection, while not a deep learning system, adds a functional intelligence layer by collating extreme price points from multiple exchanges in one place, thereby streamlining the manual research process. This combination of features gives the script a unique edge in the TradingView ecosystem, catering equally to novices wanting a straightforward approach and to advanced users looking for an aggregated multi-exchange analysis.
CONCLUSION
Uptrick: Arbitrage Monitor is a versatile and customizable Pine Script™ indicator that highlights price differences for a specified symbol between two user-selected exchanges. Through signals, threshold-based alerts, and optional Automated detection across multiple exchanges, it aims to support traders in identifying potential arbitrage opportunities quickly and efficiently. This script makes no guarantees of profitability but can serve as a valuable tool to add to your trading toolkit. Always use caution when implementing arbitrage strategies, and be mindful of market risks, exchange fees, and latency.
ADDITIONAL DISCLOSURES
This script is provided for educational and informational purposes only. It does not constitute financial advice or a guarantee of performance. Users are encouraged to conduct thorough research and consider the inherent risks of arbitrage trading. Market conditions can change rapidly, and orders may fail to execute at desired prices, especially when large price discrepancies attract competition from other traders.

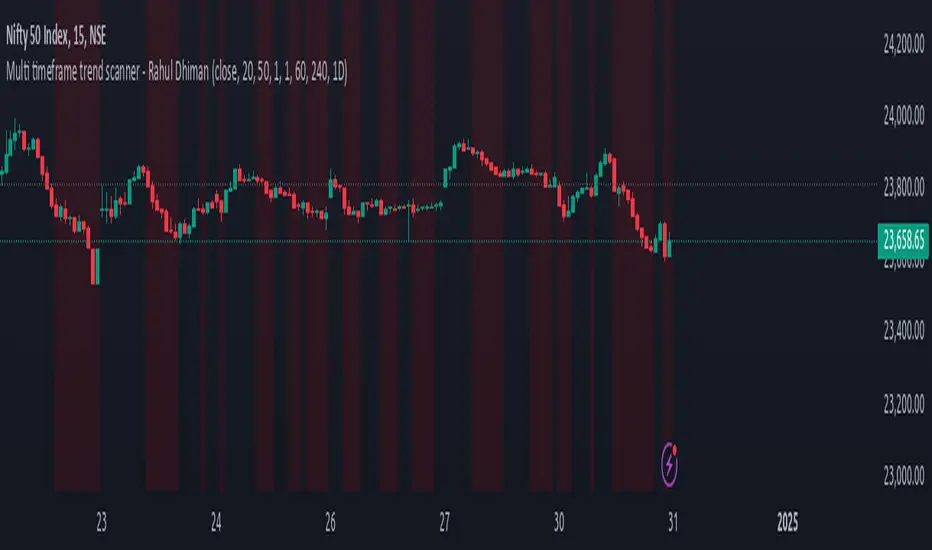
MULTI TF SCANNERMulti-Timeframe Moving Average Scanner Script
This script is designed to scan multiple timeframes for specific moving average (MA) crossovers to help traders identify potential buy or sell signals. The moving averages, such as the Simple Moving Average (SMA) or Exponential Moving Average (EMA), are calculated for different timeframes, allowing the script to provide a comprehensive analysis of the market trend.
Features:
Multiple Timeframe Analysis:
The script scans across various timeframes, including 5 minutes, 15 minutes, 1 hour, 4 hours, 1 day, and 1 week.
The moving averages are calculated for each of these timeframes, enabling the trader to gauge trends across short, medium, and long-term periods.
MA Crossover Detection:
The script checks for crossovers between a fast-moving average (e.g., 9-period) and a slow-moving average (e.g., 50-period).
A bullish crossover (fast MA crossing above slow MA) signals a potential buy, while a bearish crossover (fast MA crossing below slow MA) signals a potential sell.
Recursive Timeframe Check:
Before generating a buy or sell signal, the script checks for confirmations from higher timeframes.
Signals are only generated when the crossovers align across multiple timeframes (e.g., a buy signal on the 5-minute chart is confirmed by a bullish crossover on the 1-hour and 4-hour charts).
Signal Quality Indicator:
The script assigns a quality score to each signal based on how many higher timeframes confirm the crossover.
A stronger confirmation across multiple timeframes increases the quality of the signal, which can be visualized on the chart.
Optimized for Performance:
The calculations for moving average crossovers are designed to minimize unnecessary recalculations, optimizing the script’s performance and reducing lag.
The multi-timeframe checks are done only when the moving average crossover occurs or changes, ensuring efficiency.
User-Friendly Interface:
The results are displayed on the chart with clear visual cues to indicate the buy/sell signals and signal strength.
The script is minimalistic, with an uncluttered interface, providing the user with only the most relevant information for making trading decisions.
Fund Master Plus (TV Rev1, Dec2024)License: Mozilla Public License 2.0 (Open Source)
Version: Pine Script™ v6
Indicator Name: Fund Master Plus (TV Rev1, Dec2024)
Short Title: Fund Master Plus
About Fund Master Plus
Fund Master Plus indicator is an oscillating technical analysis tool designed to simulate the fund inflow and outflow trend.
Key features:
1. Fund Master Value and Candle
The candle highlights the direction of the Fund Master value.
Green candles represent an upward trend, while red candles indicate a downward trend.
When the candle crossover 0, it is a sign of the start of mid term bull, vice versa.
When the candle is above 0, it is a sign of mid-term bull, vice versa.
2. Fund Master Bar
This bar provides added visual representation of the Fund Master value.
Green bars represent and upward trend, while red bars indicate a downward trend.
3. FM EMA (Exponential Moving Average)
The Fund Master EMA (Exponential Moving Average) helps smooth out FM value fluctuations
and identify the overall trend.
When the candle crossover FM EMA, it is a sign of the start of short term bull, vice vera.
When the candle is above FM EMA, it is a sign of short term bull, vice versa.
4. EMA of FM EMA
This is an EMA of the Fund Master EMA, which can provide additional insights into the
trend's strength.
5. Candle Turn Green or Red
This feature generates alerts to signal potential trend changes.
6. Bottom Deviation & Top Deviation
Line plot and label of these deviation will show on indicator and the price chart to help user
identify potential buying and selling opportunities.
7. Alertcondition for Turn Green or Turn Red
User can set the alert using the Create Alert (the Clock Icon).
8. Table Summary
A table summary is provided to show indicator name, FM value, FM candle status,
Crossover, Crossunder, Turn Green, Turn Red status, Bar Number etc.
A tooltip for Filter Setting and a filter status check.
SOP to use the indicator:
Table (GR1):
Show Table: This option enables or disables the display of the table.
Text Size: This option allows you to set the text size for the table entries.
Width: This option sets the width of the table.
Fund Master Candle Color Setting (GR2):
FM candle will up by default.
This option enables the color setting of Fund Master candle.
Up: This option sets the color of the Fund Master candle for uptrend.
Down: This option sets the color of the Fund Master candle for downtrend.
Fund Master Bar and Color Setting (GR3):
Show Fund Master Bar: This option enables or disables the display of the Fund Master bar.
Up: This option sets the color of the Fund Master bar for uptrend.
Down: This option sets the color of the Fund Master bar for downtrend.
Fund Master EMA plots (GR4):
Show FM EMA: This option enables or disables the display of the Fund Master EMA line.
Look Back Period: This option sets the lookback period for the Fund Master EMA calculation.
EMA Color: This option sets the color of the Fund Master EMA line.
Show EMA of FM EMA: This option enables or disables the display of the EMA of the Fund Master EMA line.
Look Back Period 2: This option sets the lookback period for the EMA of the Fund Master EMA calculation.
Alerts: Fund Master Crossover & Crossunder EMA Line or 0 (GR5):
Show FM Crossover 0: This option enables or disables the display of the alert for FM crossover above the 0 line.
Show FM Crossunder 0: This option enables or disables the display of the alert for FM crossover below the 0 line.
Show FM Crossover EMA: This option enables or disables the display of the alert for FM crossover above the EMA line.
Show FM Crossunder EMA: This option enables or disables the display of the alert for FM crossover below the EMA line.
Bottom and Top Deviation (GR6):
Show Bottom Deviation: This option enables or disables the display of the bottom deviation line.
Show Top Deviation: This option enables or disables the display of the top deviation line.
Turn Green, Turn Red Alert (GR7):
Show Turn Green/Red Alerts: This option enables or disables the display of alerts for when the Fund Master value changes direction.
Current & Turn Green/Red Alerts: This option sets the number of bars to look back for the turn green/red alerts.
Band and User Input Setting (GR8):
100: This option enables or disables the display of the 100 band.
0: This option enables or disables the display of the 0 band.
-100: This option enables or disables the display of the -100 band.
User Input: This option enables or disables the display of a custom band based on user input.
Value: This option sets the value for the custom band.
Disclaimer
Attached chart is for the purpose of illustrating the use of indicator, no recommendation of buy/sell.
In this chart, all features in the setting are turned on (default and non default).
This chart is used to demonstrate the FM trend movement from mid-term bear to mid-term bull,
short-term bear and bull, bottom deviation and top deviation.
Hope this help. Merry Christmas and Happy New Year.
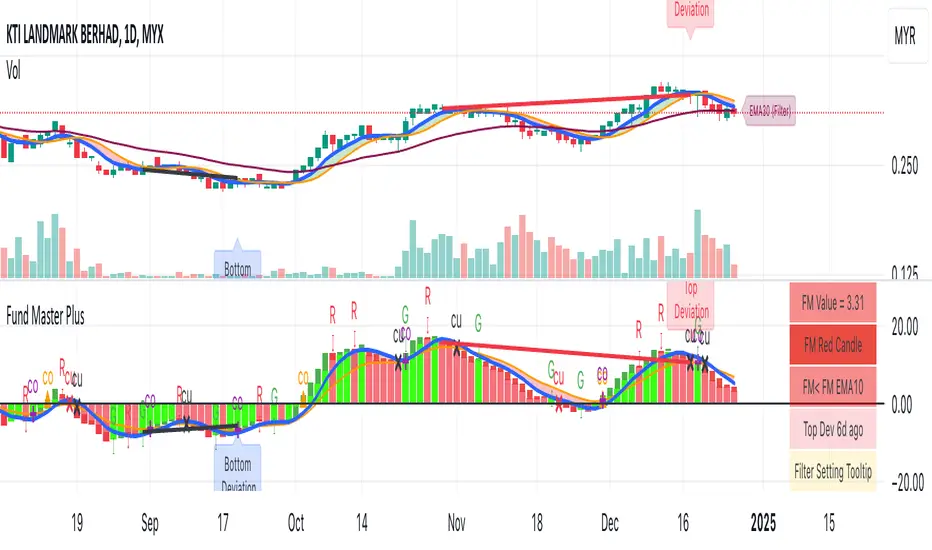
Bondar Drive v2.1Title: Bondar Drive v2.1 — Real-time print and delta tick volume visualization
Description:
Bondar Drive v2.1 is a tool for visualizing real-time order flow data. It highlights price movements and volume deltas in an intuitive, easy-to-read format. Indicator can be used in conjunction with the Anchored Volume Profile and Volume Footprint (Type: Total).
Features:
Real-Time Print Visualization:
Displays order flow prints with delta colors for buy/sell dominance.
Adjustable size and transparency for varying order thresholds.
Volume Delta Analysis:
Categorizes orders into Tiny, Small, Session, Large, and Huge based on user-defined thresholds.
Provides a tooltip showing order time and price.
Customizable Time Range:
Keeps prints visible for a specified duration (in seconds).
Flexible User Inputs:
Adjustable time zones, print sizes, starting bar index, and volume thresholds.
Visual Enhancements:
Line connections between prints show progression of orders and market direction.
How It Works:
The indicator gathers volume delta and price data in real time.
It dynamically displays circular labels with varying sizes and colors, reflecting the size and type of orders. Labels and lines are automatically removed after the specified time range, ensuring a clean and uncluttered chart.
Customization Options:
Number of Prints: Control how many prints are displayed.
Order Size Filters: Exclude small trades to highlight significant orders.
Color Options: Customize print colors, text, and connecting lines.
Time Offset: Adjust for your local time zone.
Use Cases:
Identify order flow imbalances and price levels dominated by buyers or sellers.
Track the progression of large orders for better trade execution.
Spot market reversals and momentum shifts using real-time prints and delta.

Force Volume GradientThis Pine Script is a technical indicator designed for trading platforms, specifically TradingView. It plots the Force Volume Gradient (FVG) and generates buy/sell signals based on the crossover of the FVG line and a signal line.
Key Components:
Force Index: Calculates the exponential moving average (EMA) of the product of the close price and volume.
Force Volume Gradient (FVG): Calculates the EMA of the Force Index.
Signal Line: A simple moving average (SMA) of the FVG.
Buy/Sell Signals: Generated when the FVG line crosses above/below the signal line.
How it Works:
The script calculates the Force Index, which measures the amount of energy or "force" behind price movements.
The FVG is then calculated by applying an EMA to the Force Index, smoothing out the values.
The signal line is a SMA of the FVG, providing a benchmark for buy/sell signals.
When the FVG line crosses above the signal line, a buy signal is generated. Conversely, when the FVG line crosses below the signal line, a sell signal is generated.
Trading Strategy:
This script can be used as a momentum indicator to identify potential buying or selling opportunities. Traders can use the buy/sell signals as entry/exit points, or combine the FVG with other indicators to create a more comprehensive trading strategy.
Customization:
Users can adjust the input parameters, such as the length of the Force Index and signal line, to suit their individual trading preferences.

Adapted RSI w/ Multi-Asset Regime Detection v1.1The relative strength index (RSI) is a momentum indicator used in technical analysis. RSI measures the speed and magnitude of an asset's recent price changes to detect overbought or oversold conditions in the price of said asset.
In addition to identifying overbought and oversold assets, the RSI can also indicate whether your desired asset may be primed for a trend reversal or a corrective pullback in price. It can signal when to buy and sell.
The RSI will oscillate between 0 and 100. Traditionally, an RSI reading of 70 or above indicates an overbought condition. A reading of 30 or below indicates an oversold condition.
The RSI is one of the most popular technical indicators. I intend to offer a fresh spin.
Adapted RSI w/ Multi-Asset Regime Detection
Our Adapted RSI makes necessary improvements to the original Relative Strength Index (RSI) by combining multi-timeframe analysis with multi-asset monitoring and providing traders with an efficient way to analyse market-wide conditions across different timeframes and assets simultaneously. The indicator automatically detects market regimes and generates clear signals based on RSI levels, presenting this data in an organised, easy-to-read format through two dynamic tables. Simplicity is key, and having access to more RSI data at any given time, allows traders to prepare more effectively, especially when trading markets that "move" together.
How we calculate the RSI
First, the RSI identifies price changes between periods, calculating gains and losses from one look-back period to the next. This look-back period averages gains and losses over 14 periods, which in this case would be 14 days, and those gains/losses are calculated based on the daily closing price. For example:
Average Gain = Sum of Gains over the past 14 days / 14
Average Loss = Sum of Losses over the past 14 days / 14
Then we calculate the Relative Strength (RS):
RS = Average Gain / Average Loss
Finally, this is converted to the RSI value:
RSI = 100 - (100 / (1 + RS))
Key Features
Our multi-timeframe RSI indicator enhances traditional technical analysis by offering synchronised Daily, Weekly, and Monthly RSI readings with automatic regime detection. The multi-asset monitoring system allows tracking of up to 10 different assets simultaneously, with pre-configured major pairs that can be customised to any asset selection. The signal generation system provides clear market guidance through automatic regime detection and a five-level signal system, all presented through a sophisticated visual interface with dynamic RSI line colouring and customisable display options.
Quick Guide to Use it
Begin by adding the indicator to your chart and configuring your preferred assets in the "Asset Comparison" settings.
Position the two information tables according to your preference.
The main table displays RSI analysis across three timeframes for your current asset, while the asset table shows a comparative analysis of all monitored assets.
Signals are colour-coded for instant recognition, with green indicating bullish conditions and red for bearish conditions. Pay special attention to regime changes and signal transitions, using multi-timeframe confluence to identify stronger signals.
How it Works (Regime Detection & Signals)
When we say 'Regime', a regime is determined by a persistent trend or in this case momentum and by leveraging this for RSI, which is a momentum oscillator, our indicator employs a relatively simple regime detection system that classifies market conditions as either Bullish (RSI > 50) or Bearish (RSI < 50). Our benchmark between a trending bullish or bearish market is equal to 50. By leveraging a simple classification system helps determine the probability of trend continuation and the weight given to various signals. Whilst we could determine a Neutral regime for consolidating markets, we have employed a 'neutral' signal generation which will be further discussed below...
Signal generation occurs across five distinct levels:
Strong Buy (RSI < 15)
Buy (RSI < 30)
Neutral (RSI 30-70)
Sell (RSI > 70)
Strong Sell (RSI > 85)
Each level represents different market conditions and probability scenarios. For instance, extreme readings (Strong Buy/Sell) indicate the highest probability of mean reversion, while neutral readings suggest equilibrium conditions where traders should focus on the overall regime bias (Bullish/Bearish momentum).
This approach offers traders a new and fresh spin on a popular and well-known tool in technical analysis, allowing traders to make better and more informed decisions from the well presented information across multiple assets and timeframes. Experienced and beginner traders alike, I hope you enjoy this adaptation.
